In recent years, the ESET Latin America Investigation Laboratory has witnessed a growth in malware developed using scripting languages. This is why we now want to demonstrate how to configure a dynamic analysis environment to isolate such threats so we can understand and observe their behavior in a controlled environment.
What do we mean by "debug?"
This is a process which enables the controlled execution of a program or code, so we can follow each executed instruction step-by-step. This process is normally used by software developers to find bugs or faults in their projects.
Step by step with Visual Studio
To carry out this technique, we need a virtual machine using Windows 7 and the Microsoft Visual Studio IDE. This is a tool generally used by software developers. In practice, the free version is more than enough for the job.
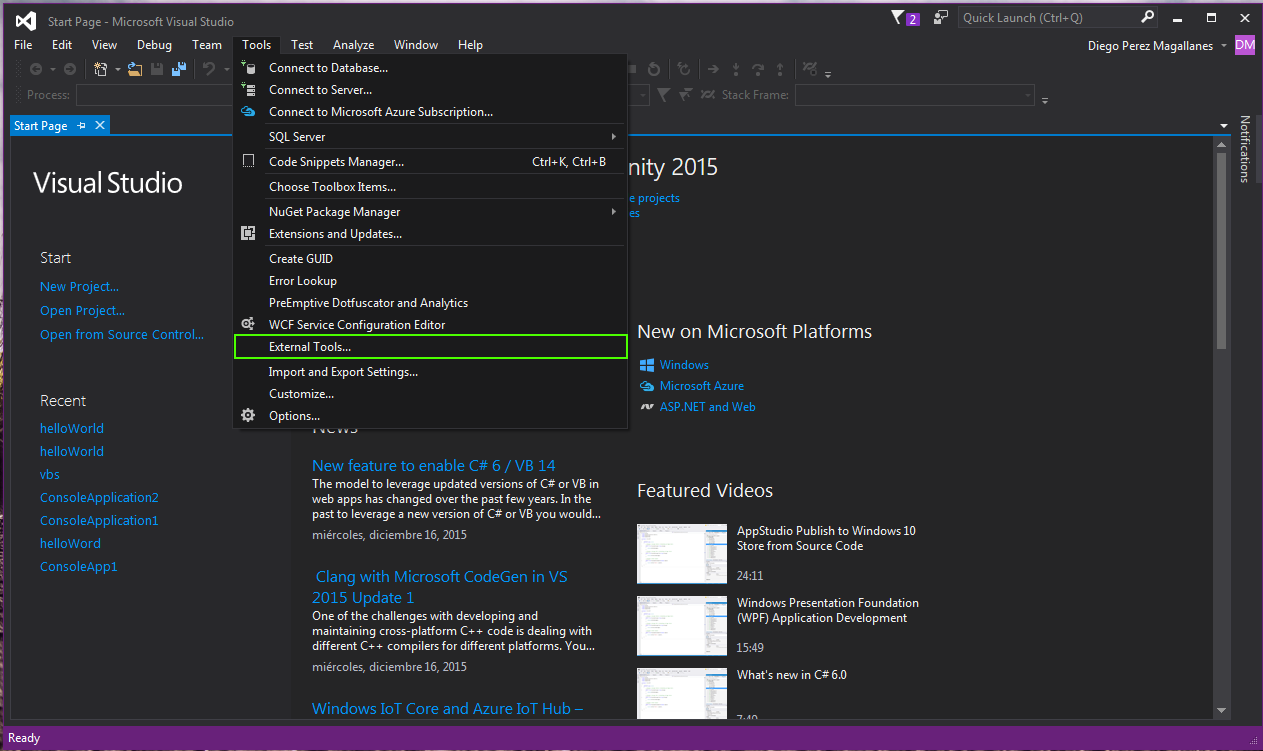
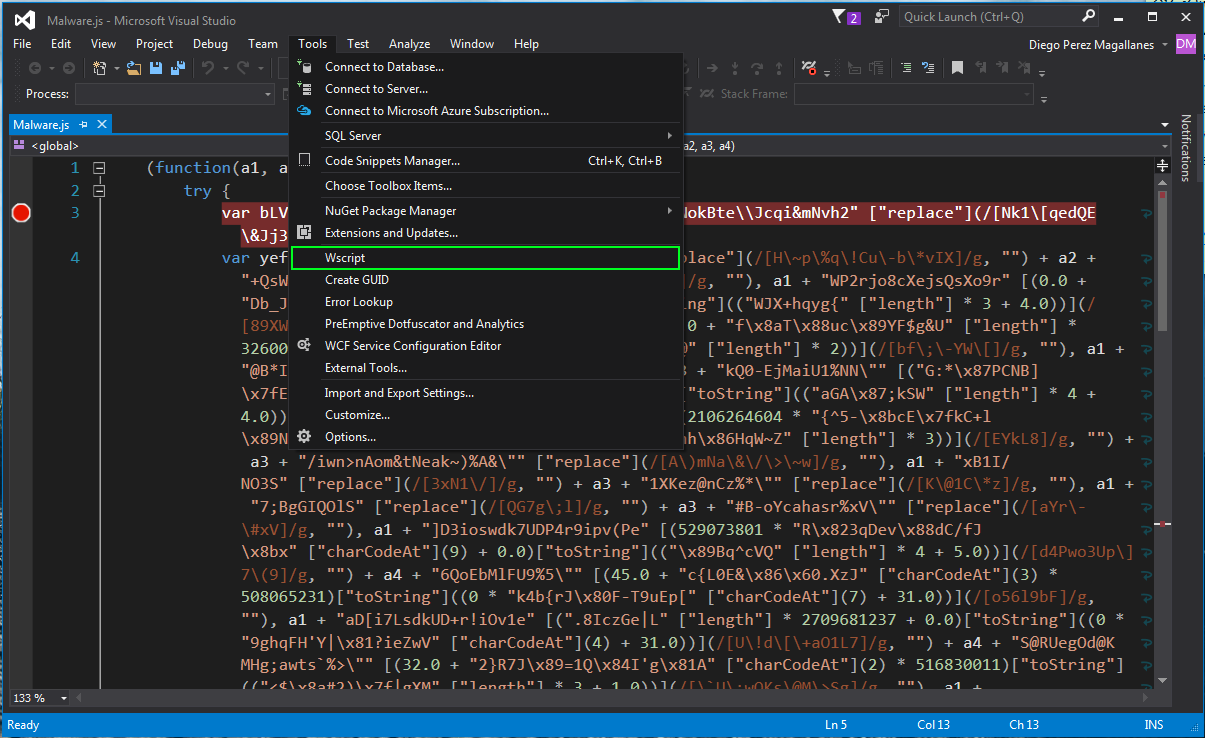
After installing Visual Studio, we need to configure the tool to isolate the malicious files, which are interpreted by Microsoft "wscript.exe." From the main screen, we go to "Tools," then "External Tools...," as shown in the image below:
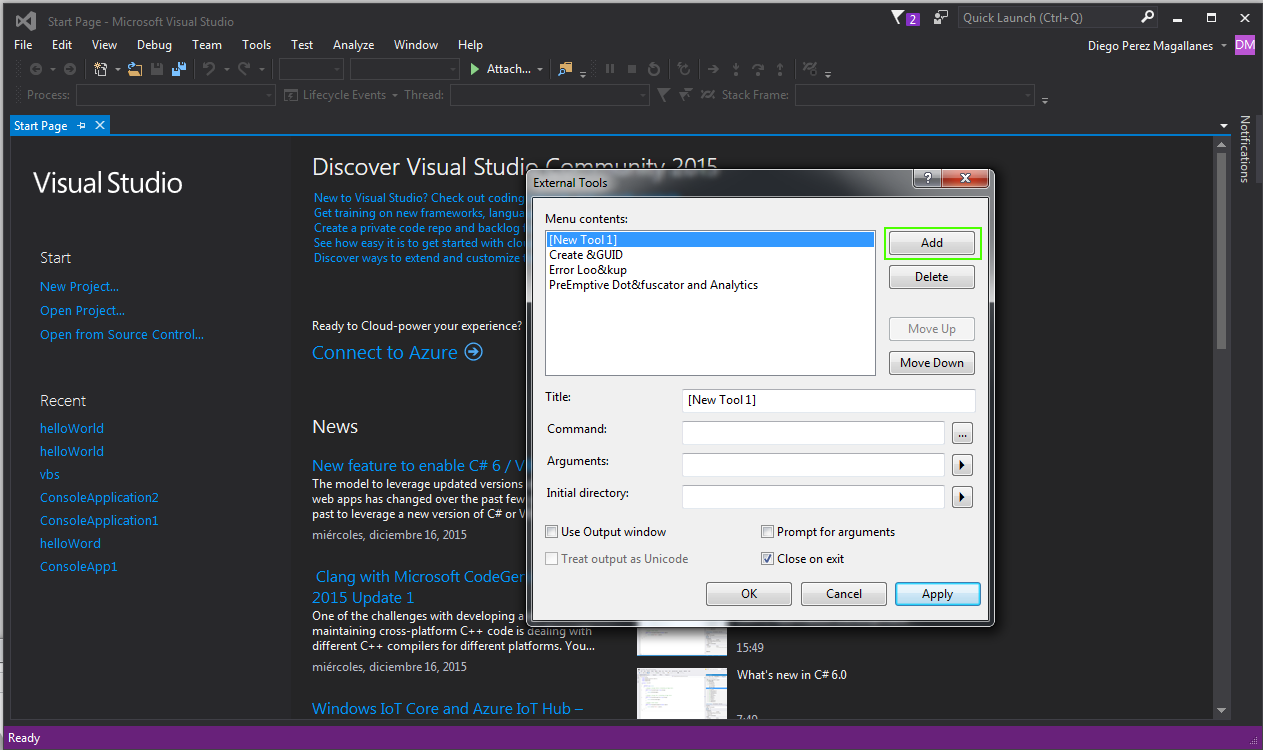
Once we have done this, a window opens in which we aggregate and configure the tool by clicking on the "Add" button:
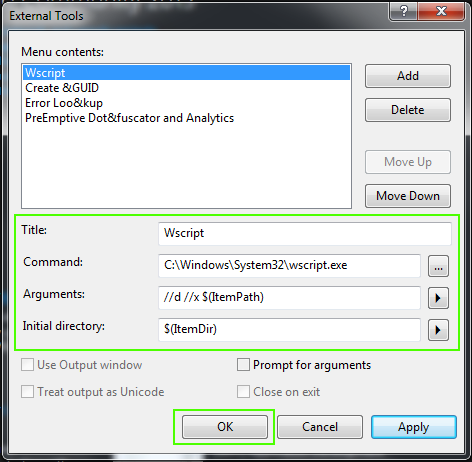
We then complete the following fields with the data shown in the image. We put "//d" in the "Arguments" field so the isolated shell is activated, and "//x" to start the command sequence in the isolated shell. Finally, we click on "OK" to save the configuration.
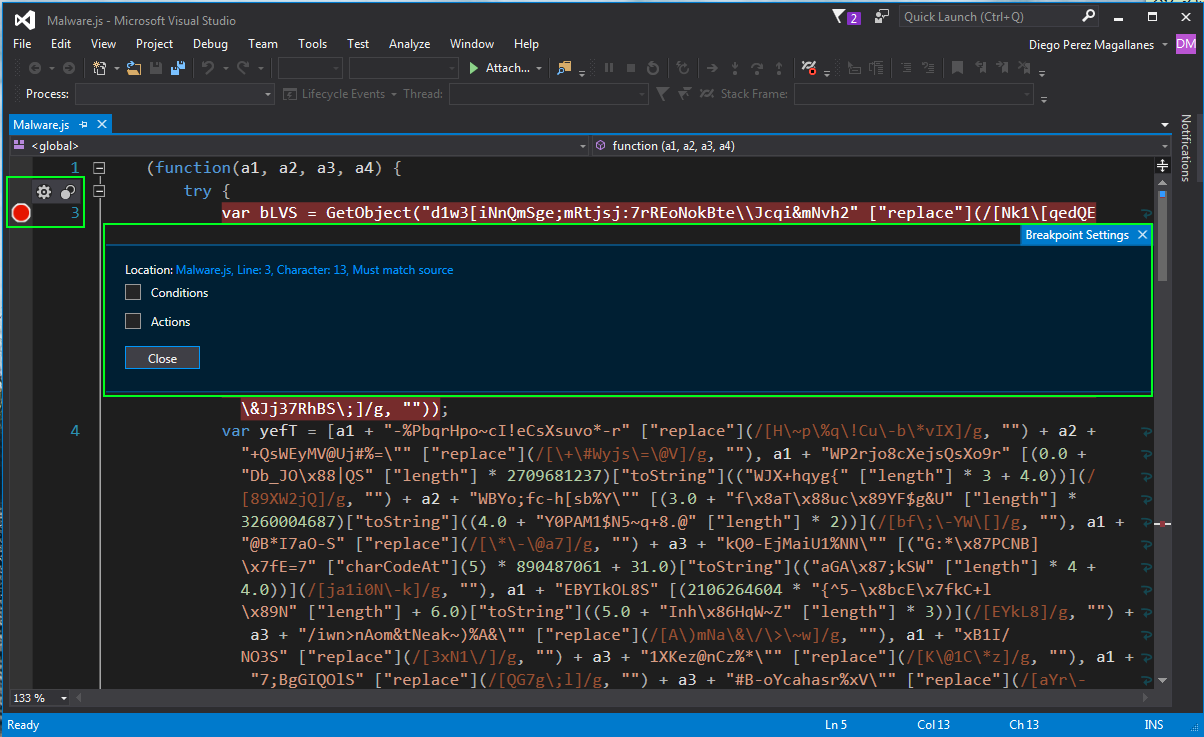
Now we're ready to get to work. For this demonstration, we are using a threat developed in JavaScript, which ESET detected under the name of JS/Bondat.A. When we open the file, we see the code obfuscated by the cybercriminal to hide the true intention behind the malicious code. To the left of the lines of code we can establish breakpoints, as symbolized by a red circle to indicate to the isolated shell at which instruction we want to stop the usual flow of the program:
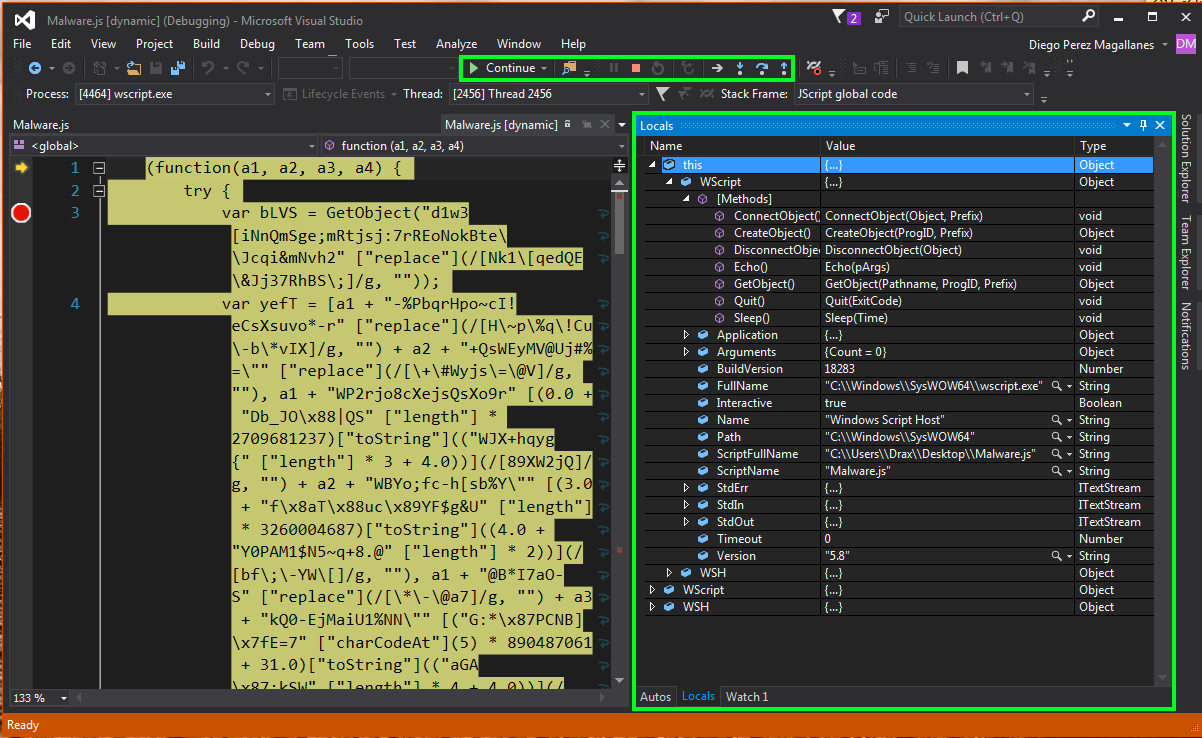
We begin the isolation in the "Tools" menu, where we click on "Wscript." This is the name we are giving our tool:
Here we see that the banner at the bottom of the Visual Studio screen is colored orange. This tells us that we have succeeded in correctly executing our debugger. We then see a number of buttons we can use to control how we want to execute the malicious code. Another important point is shown in the next image. We see all kinds of data. This might be the value of a variable, counters, arrays, the methods and functions used by the program, arguments, etc.
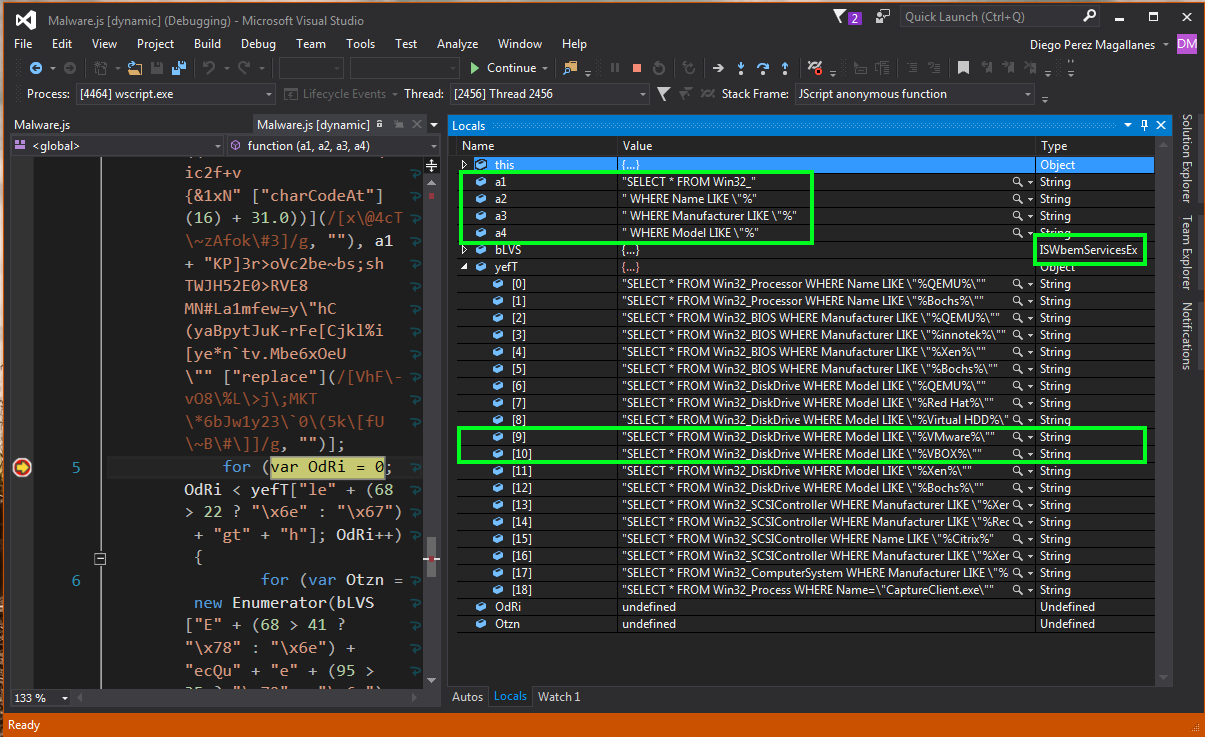
We carry on isolating the malicious code, starting by looking at the changing values. For example, the following image shows variables a1, a2, a3 and a4 acquiring string type values. We can also see that the code uses "ISWbemServicesEx," which means that the malware uses WMI (Windows Management Instrumentation), which is used by cybercriminals to extract information from the victim.
As well as this, we get a simple overview of "%VMware%" and "%VBOX%" text chains, as shown in the following image. This is a clear example of an anti-virtualization technique, to avoid the code from being executed in potential virtual analysis environments.
This is one of the methods we use at the ESET Laboratory to analyze a file written in JavaScript, Visual Basic Script or any language executed by the Wscript interpreter, step by step. By doing this, we can combat malicious code which attempts to take advantage of users. Using these processes and tools, we can study each step in a possible malware infection, understand its goals and grab the original code from samples which are strongly obfuscated.
If you would like to learn more about Malware Analysis, you can join our ESET ACADEMY course—the biggest data security e-learning platform in Latin America.