Hands up who believes that OS X and iOS are the most vulnerable operating systems in use today? Well, I find it a bit hard to believe, too, even though I’ve had a lot of hate-mail over the years for pointing out that Apple’s operating systems are not invulnerable. Yet this is the tenor of GFI’s article Most vulnerable operating systems and applications in 2014, based on data from the National Vulnerability Database, and it’s caused a certain (muted) uproar in security reporting circles. I suspect it’s generated a certain amount of hate-mail too, judging from the tone of some of the comments to the blog. Curiously, some of the comments are centred on ‘bad journalism’, which seems to miss the point that Cristian Florian is actually a product manager, not a journalist:
‘He currently oversees GFI LanGuard, a successful network security scanning and patch management solution.’
While some of the comments I’ve seen in the security industry have suggested that this role might make his commentary less than impartial, I think it’s fair to assume that he does know something about the topic. But is he right? Well, I guess it depends on your definition of vulnerable.
Some people, notably Graham Cluley, have pointed out some perceived oddities in the methodology behind his conclusions.
…each version of Microsoft Windows gets its own entry—but Apple operating systems have their different versions lumped together.
This gave the superficial impression that the article was biased, because if you added up all the vulnerabilities for various Windows versions, they came to 248, a lot more than the 147, 127 and 119 attributed respectively to OS X, iOS, and the Linux kernel. Florian subsequently took that issue on board and pointed out that because ‘a lot of Windows vulnerabilities apply to multiple Windows versions’, the aggregated total for Windows would be 68. Still, it might have been clearer to have split the other operating systems by version, too, though his conclusions might have been less dramatic. The updated section does benefit from a breakdown of vulnerabilities for individual Linux distributions, however.
I have other problems with the granularity of this commentary, though. The data do tell us something about the frequency of updates for individual platforms, but not how promptly they’re addressed, or whether they were ever exploited and to what extent. In fact, there’s no remediation information at all: entries aren’t removed from the NVD database when they’re remediated, and the blog doesn’t include information either way.
While there are pointers here to individual vulnerabilities discovered for each of several platforms, but not about the safety of the individual using the platform: there are many other factors that govern the security of a system. After all, both Windows and Android are subject to much higher volumes of malware than either OS X or iOS, though opinion varies on how to measure the impact of those volumes. And in fact, 83% of the vulnerabilities listed are specific to applications – with a particular emphasis on browsers and other multi-platform utilities (Java, assorted Adobe programs) rather than the operating system, which may put the much-hyped war of the operating systems into perspective.
The updated article makes it clear that
…the aim of the article is not to blame anyone - Apple or Linux or Microsoft. The message I am trying to get across is that all software products have vulnerabilities.
That seems slightly at odds with the original article and the whole principle of drawing conclusions from a comparison of totals: do we need to know the figures in order to prove that ‘all software products have vulnerabilities? Well, perhaps we do: it’s clear from some comments that some commenters are quite happy to ignore the figures if they don’t accord with their anti-Microsoft prejudices.
Florian asserts that the frequency of updates increases as the product becomes more popular: that doesn’t seem altogether borne out by the results, given how Microsoft’s market share outweighs that of all other desktop operating systems. Furthermore, while the difference between Android and iOS market share is undramatic, the difference between the six unequivocal vulnerabilities attributed to Android and the 127 apparently enjoyed by iOS users is. However, he doesn’t tell us how many of the 119 Linux kernel vulnerabilities reported apply to Android, and I’m certainly not convinced enough of the value of this type of analysis to go and count them for myself. I suppose it could be argued that more effort is put into vulnerability research as market share increases, and less as a product matures, but that’s really speculative.
The company sums up:
At GFI we would like the people to use the information as a guide and to show which areas to pay more attention to when patching their systems.
That sounds fair enough, but unless you’re prepared to dive into the NVD and CVE sites to check out the details of all those vulnerabilities for yourself, I suspect that you’re not going to learn much more than that any major operating system may have vulnerabilities – as was indeed true back in the heyday of the mainframe – and that maintaining and updating applications might be as important (sometimes more so) than maintaining the operating system. Though the article does at least note the NVD’s classification by criticality for each category.
Here’s why the GFI article worries me, as do (even more) some of the more generalist articles that have picked up uncritically on fairly superficial aspects of the research behind it.
If you'll excuse a little personal reminiscence... Once upon a time my wife and I owned a small but rambling Victorian villa in the English Midlands. Given its age and its nearness to both a busy railway station and to fluvioglacial landforms, it’s unsurprising that, like many houses in the area of a similar age, its external walls had been strengthened at some point by inserting tie rods. When the time came for us to leave the area, we got a certain wry amusement from potential buyers who would try to beat us down on the price because they’d noticed the anchor plates signifying the presence of tie rods. If you’re thinking of buying a house in an area like that, might you not actually prefer to buy one where that reinforcement had already been done?
In the same way, it seems inappropriate to me to encourage the lay reader to measure the security of an operating system by the number of reported vulnerabilities. Perhaps if there’d been more information than is given in this case about the nature of each vulnerability, links or at least suitable search terms for looking at the detail of the vulnerabilities, and information on how responsive the companies behind the software were in each case, the article would have been more useful. I appreciate, of course, that such a level of detail would have required considerable effort, but I’m sure it would have been appreciated by the ‘IT administrators’ who were addressed here.
If you are looking for Windows-specific information on vulnerabilities and patching at a much greater level of detail, I’m inclined to recommend this report from one of my colleagues at ESET: Windows Exploitation in 2014.
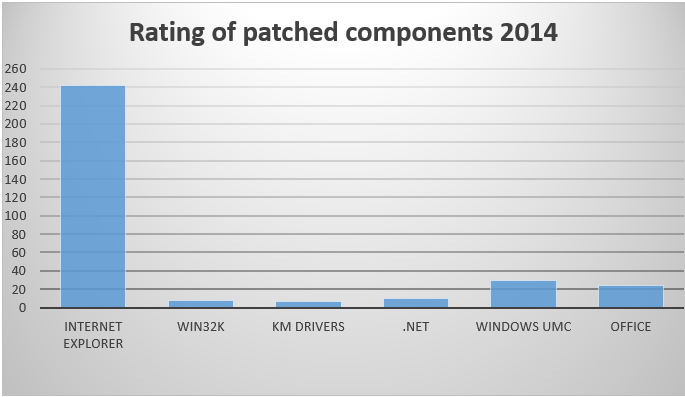
It’s particularly focused on Internet Explorer – unsurprisingly, given how many patches it needed in 2014 compared to other Windows components – but is also informative on the distribution of specific types of exploit.
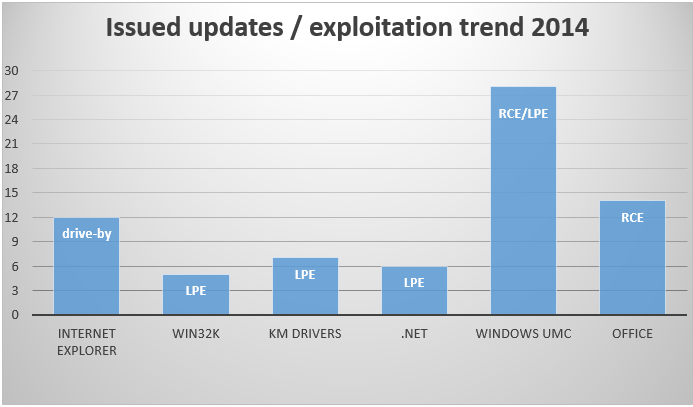
This figure from the 16-page paper shows distribution relative to drive-by, LPE (Local Privilege Escalation) and RCE (Remote Code Execution) exploits across a wide range of components, including Kernel Mode (KM) drivers and User Mode Components (UMC).